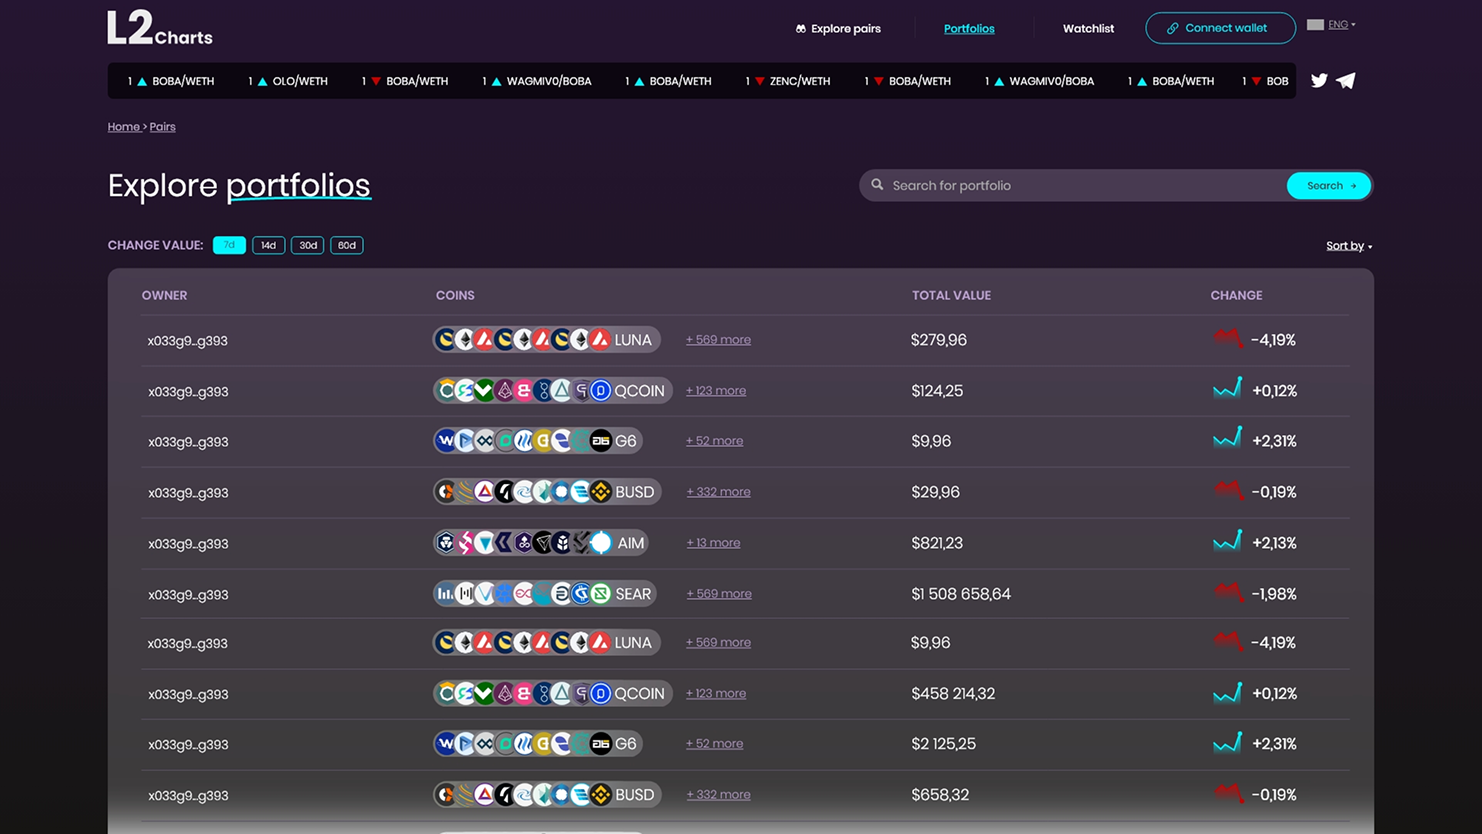
L2 Charts - The bridge between traditional exchanges and P2P
March 2023 - September 2023
Tools i used

Figma

Miro

Adobe Illustrator

Adobe Photoshop
My role
As the lead UX/UI Designer on this project, I was responsible for the end-to-end design process, including:
- Information Architecture: Defining the structure and hierarchy of the platform.
- User Personas: Conducting research to define target user profiles and their needs.
- User Flow Diagrams: Mapping out seamless navigation paths for key trading tasks.
- UI Design: Creating a high-fidelity visual interface for both desktop and mobile.
- Wireframing: Developing low and high-fidelity wireframes to test layouts.
- Prototyping: Building a fully functional interactive prototype for user testing and handoff.
Project context and problem
Project context and problem
Users accustomed to the high liquidity and familiar layouts of centralized exchanges (CEX) often find P2P models fragmented or unintuitive.
Project context and problem
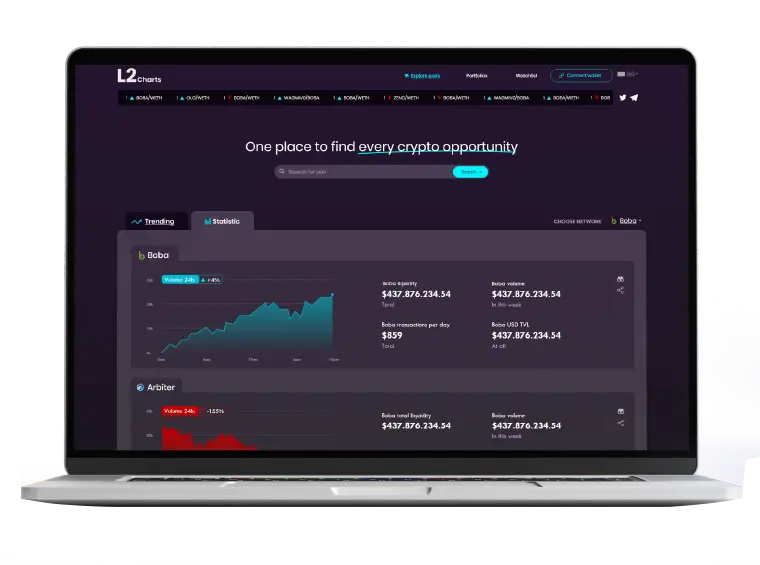
To create a "Zero-Learning Curve" interface. The layout needed to feel familiar enough for pro-traders to find their tools instantly, while remaining simple enough to build trust with beginners.
The mechanics
Implementing a direct exchange model (User-Platform-User) without sacrificing the real-time feel of a traditional trading desk.
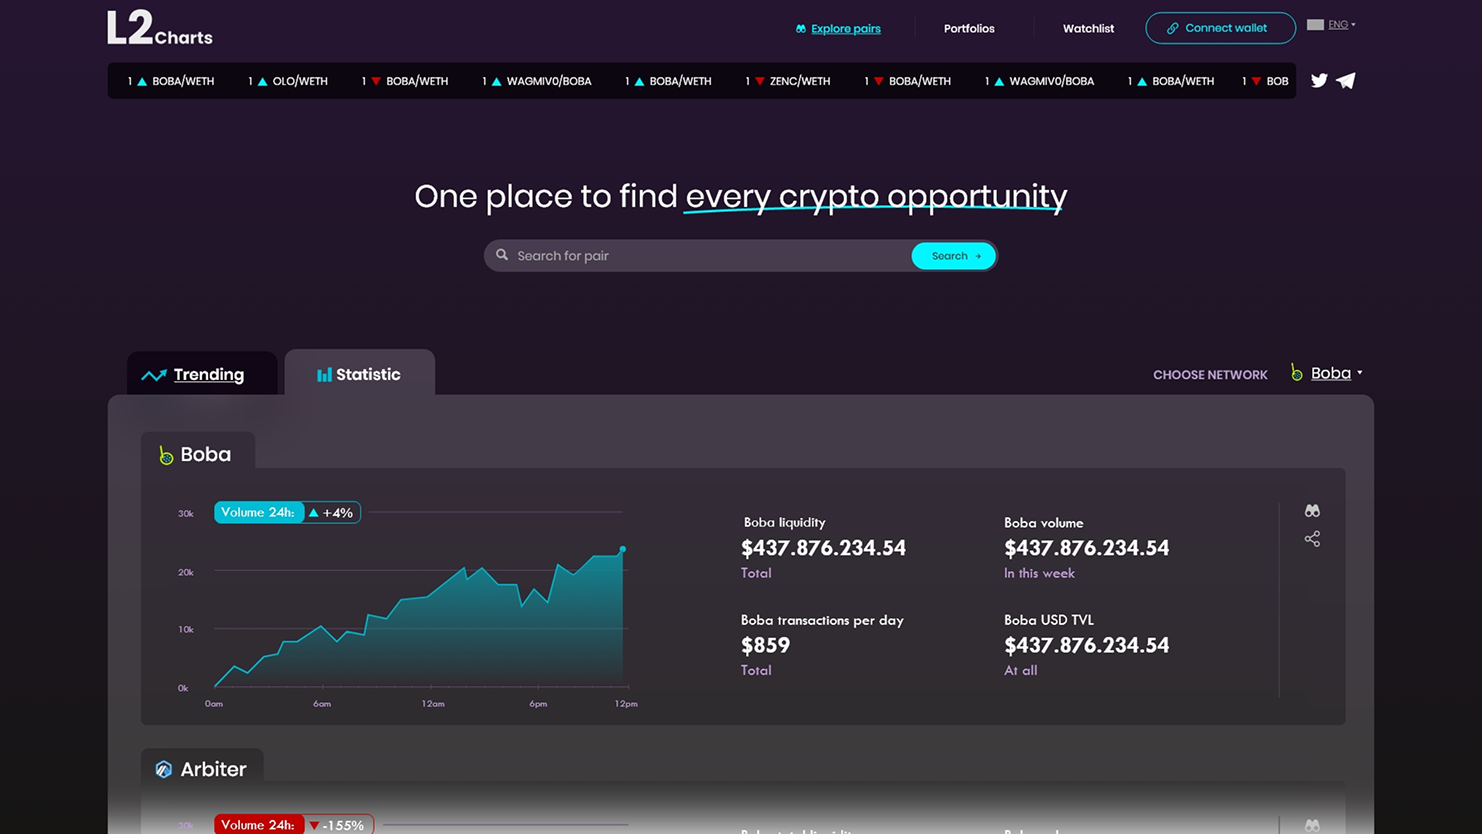
Design Strategy
Leveraging Mental Models:
I deliberately chose the "Industry Standard" layout (centralized charts with lateral order books). Following Jakob’s Law allowed me to reduce cognitive load and focus user attention on the P2P transaction flow.
Frictionless P2P Flow
Even though the underlying engine is P2P, I designed the deposit-to-trade journey to be as seamless as a CEX. The user interacts with a familiar interface, while the platform handles the asset matching in the background.
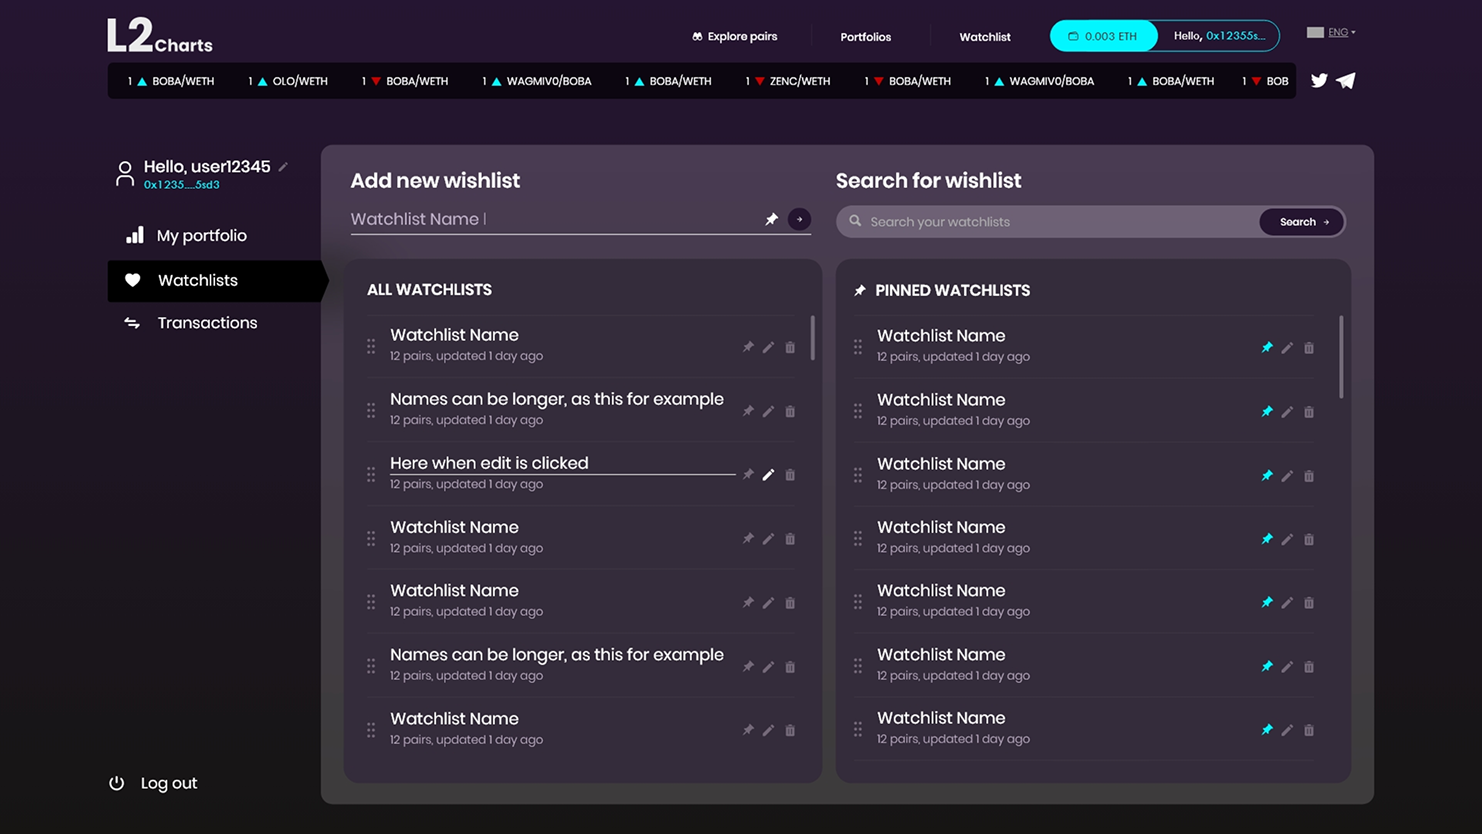
Key Features
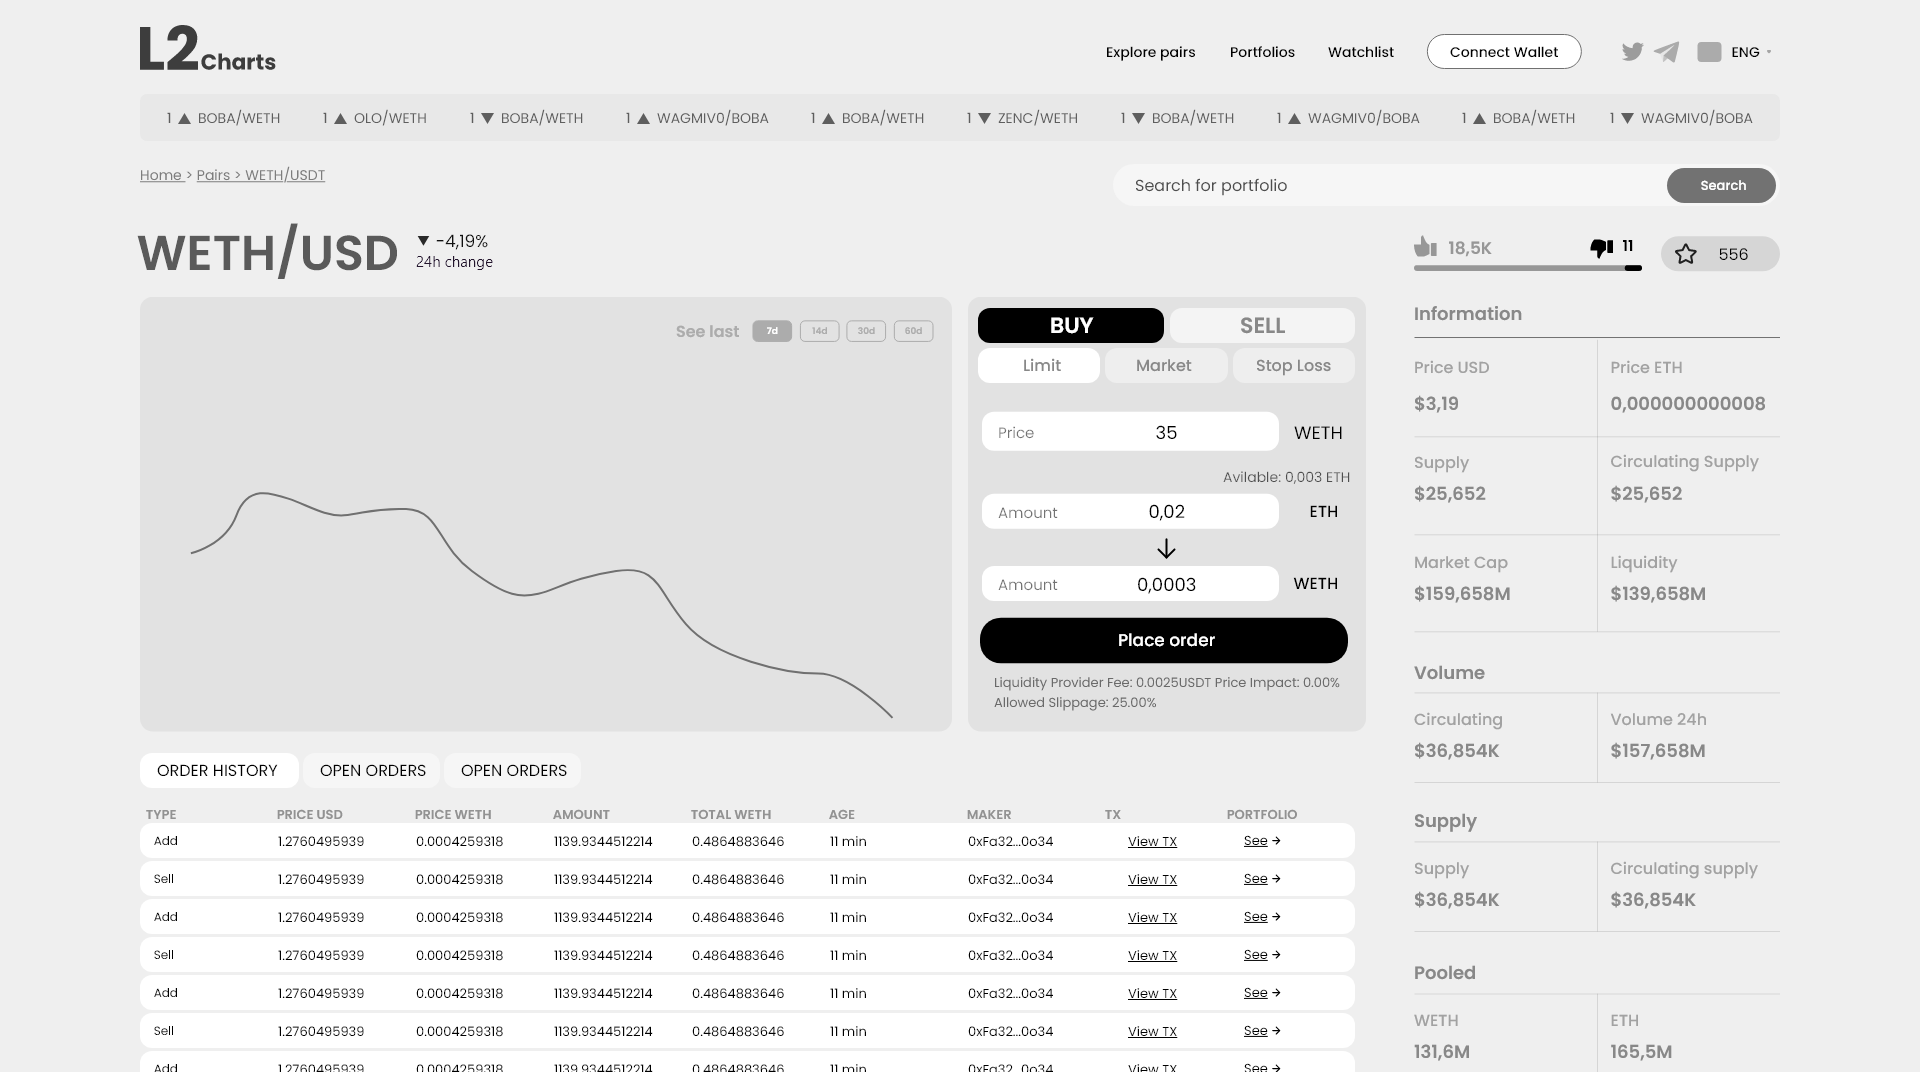
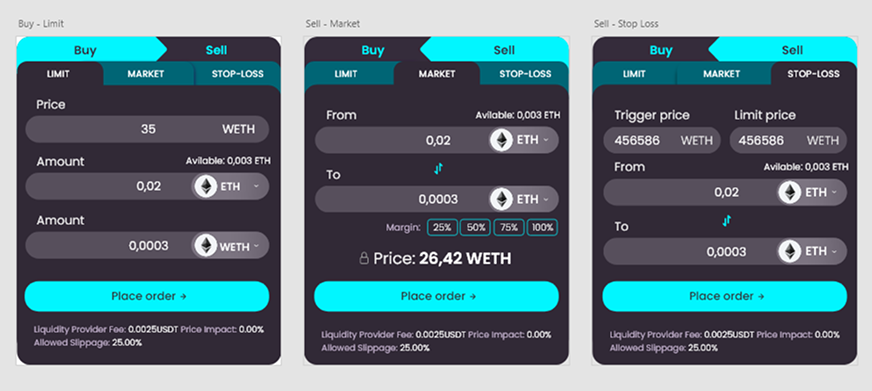
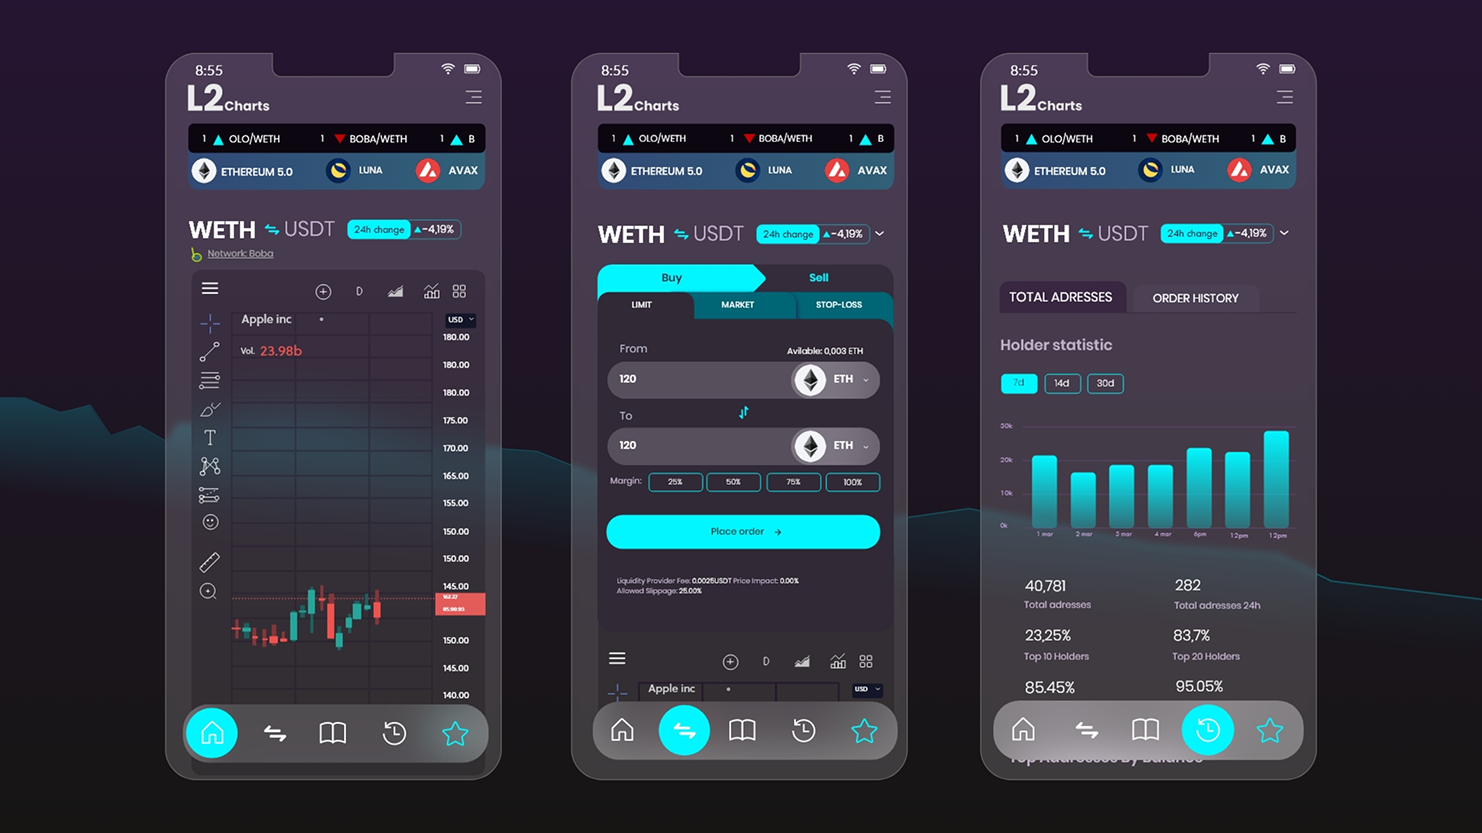
High-Confidence Order Forms:
Buy/Sell modules modeled after the world’s leading exchanges to minimize user error and anxiety.
Scalable Visual Language:
To ensure consistency across hundreds of trading pairs, I developed a comprehensive Design System focusing on:Financial State Colors: High-contrast palettes for Bullish/Bearish indicators.
User-Centric Research
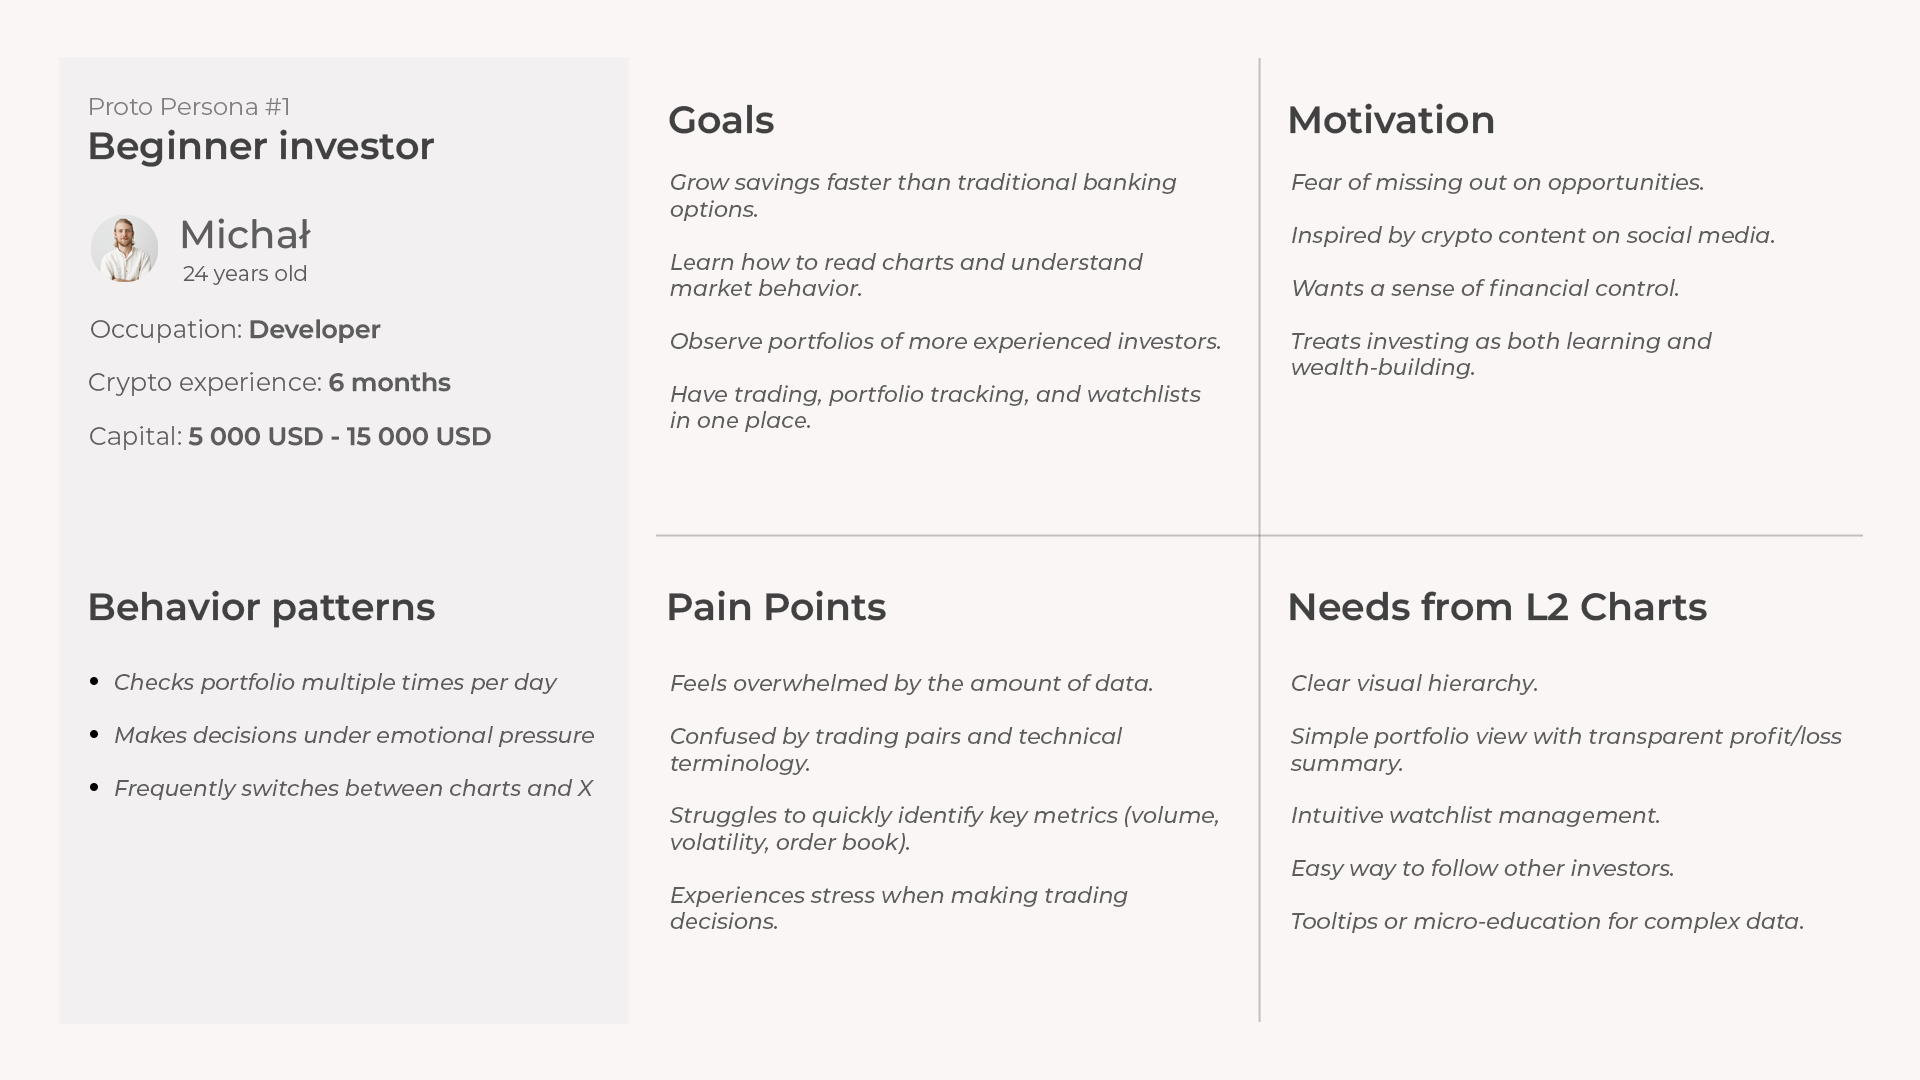
Personas
First step of the process was empathizing with a potential users. For that i created User Personas, underlining their needs and expectations
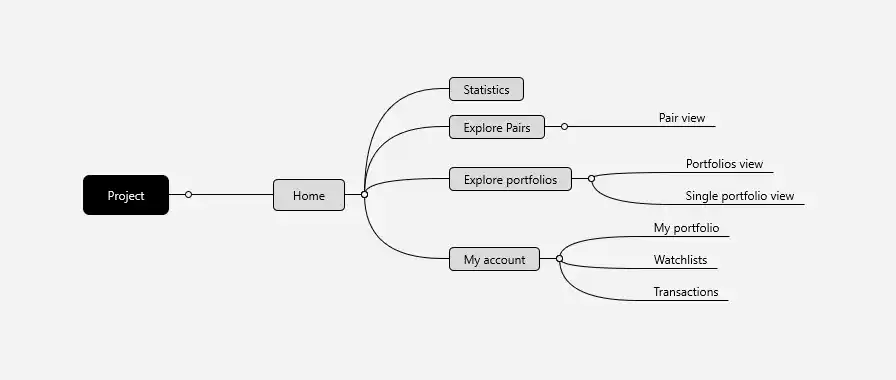
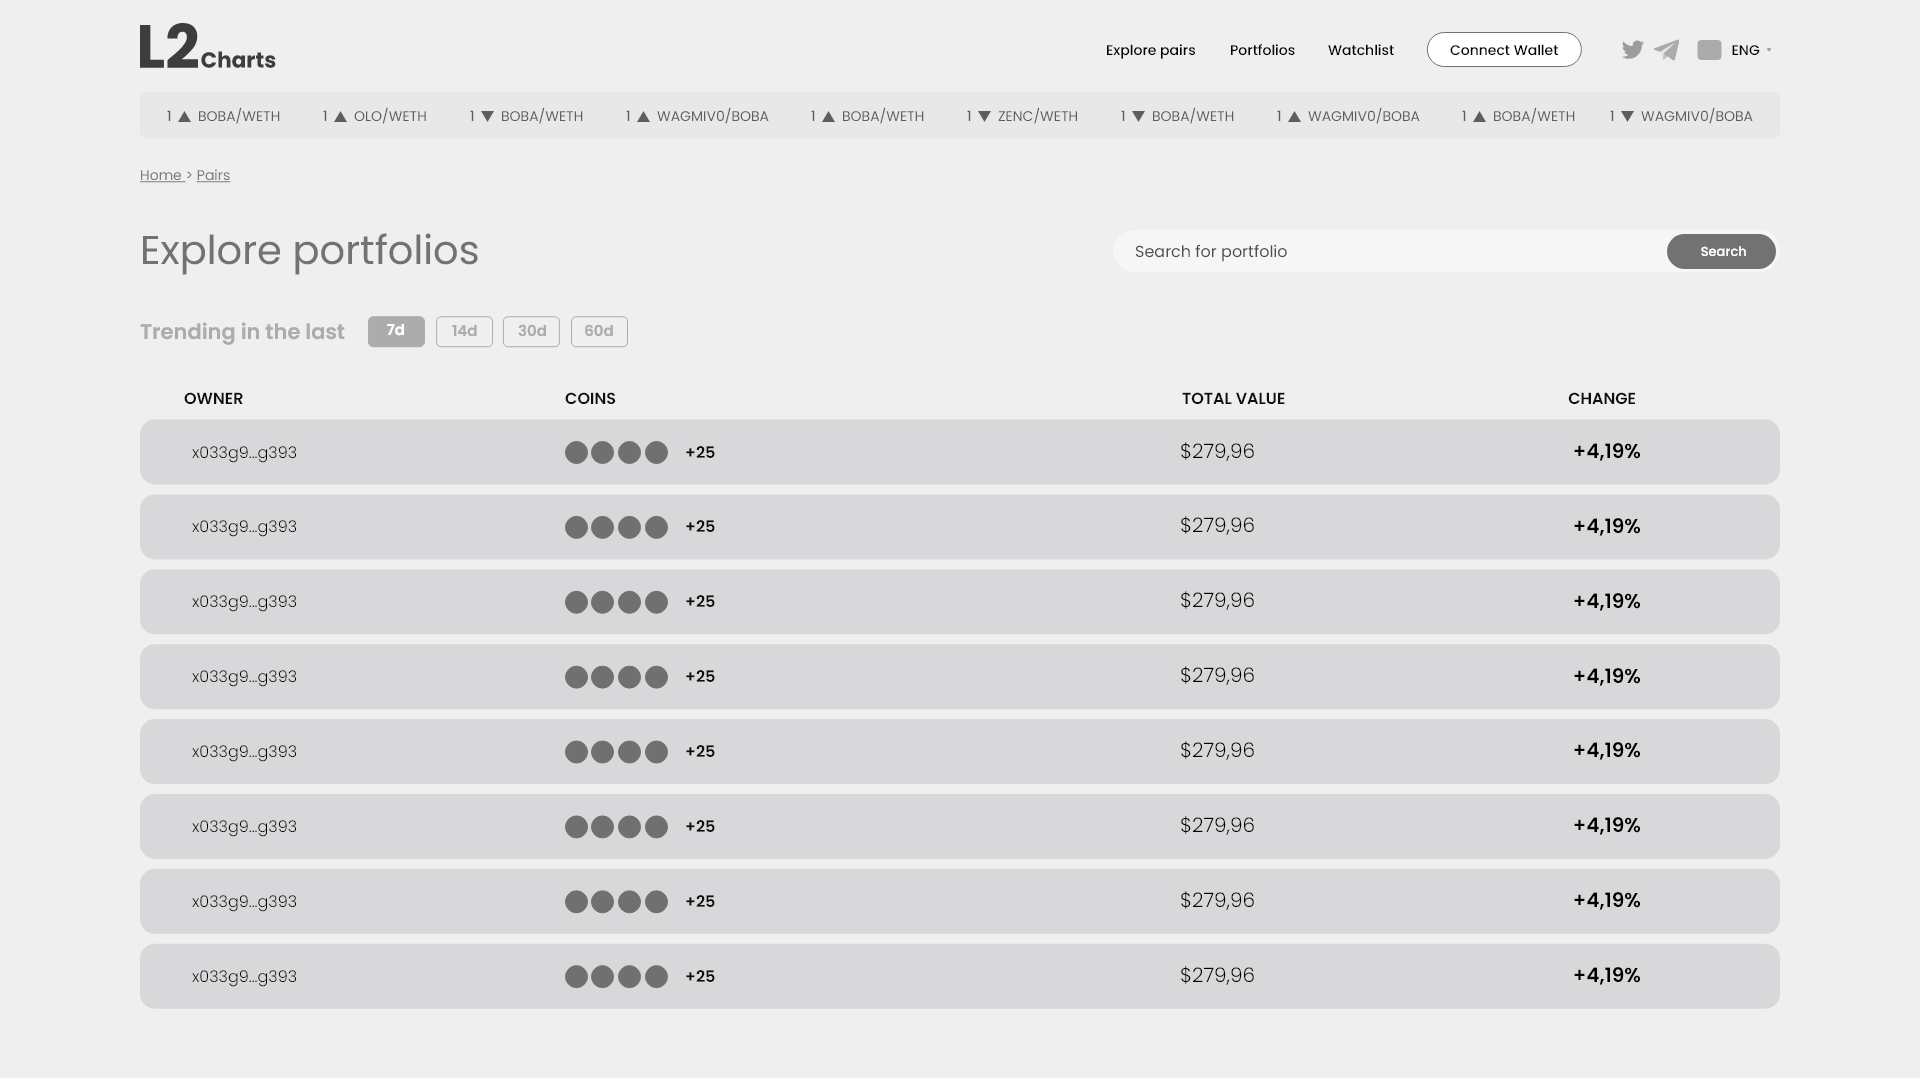
Simple sitemap
I initiated the design process by creating a simple sitemap to visualize all page levels, ensuring a logical and transparent navigation hierarchy across the platform.
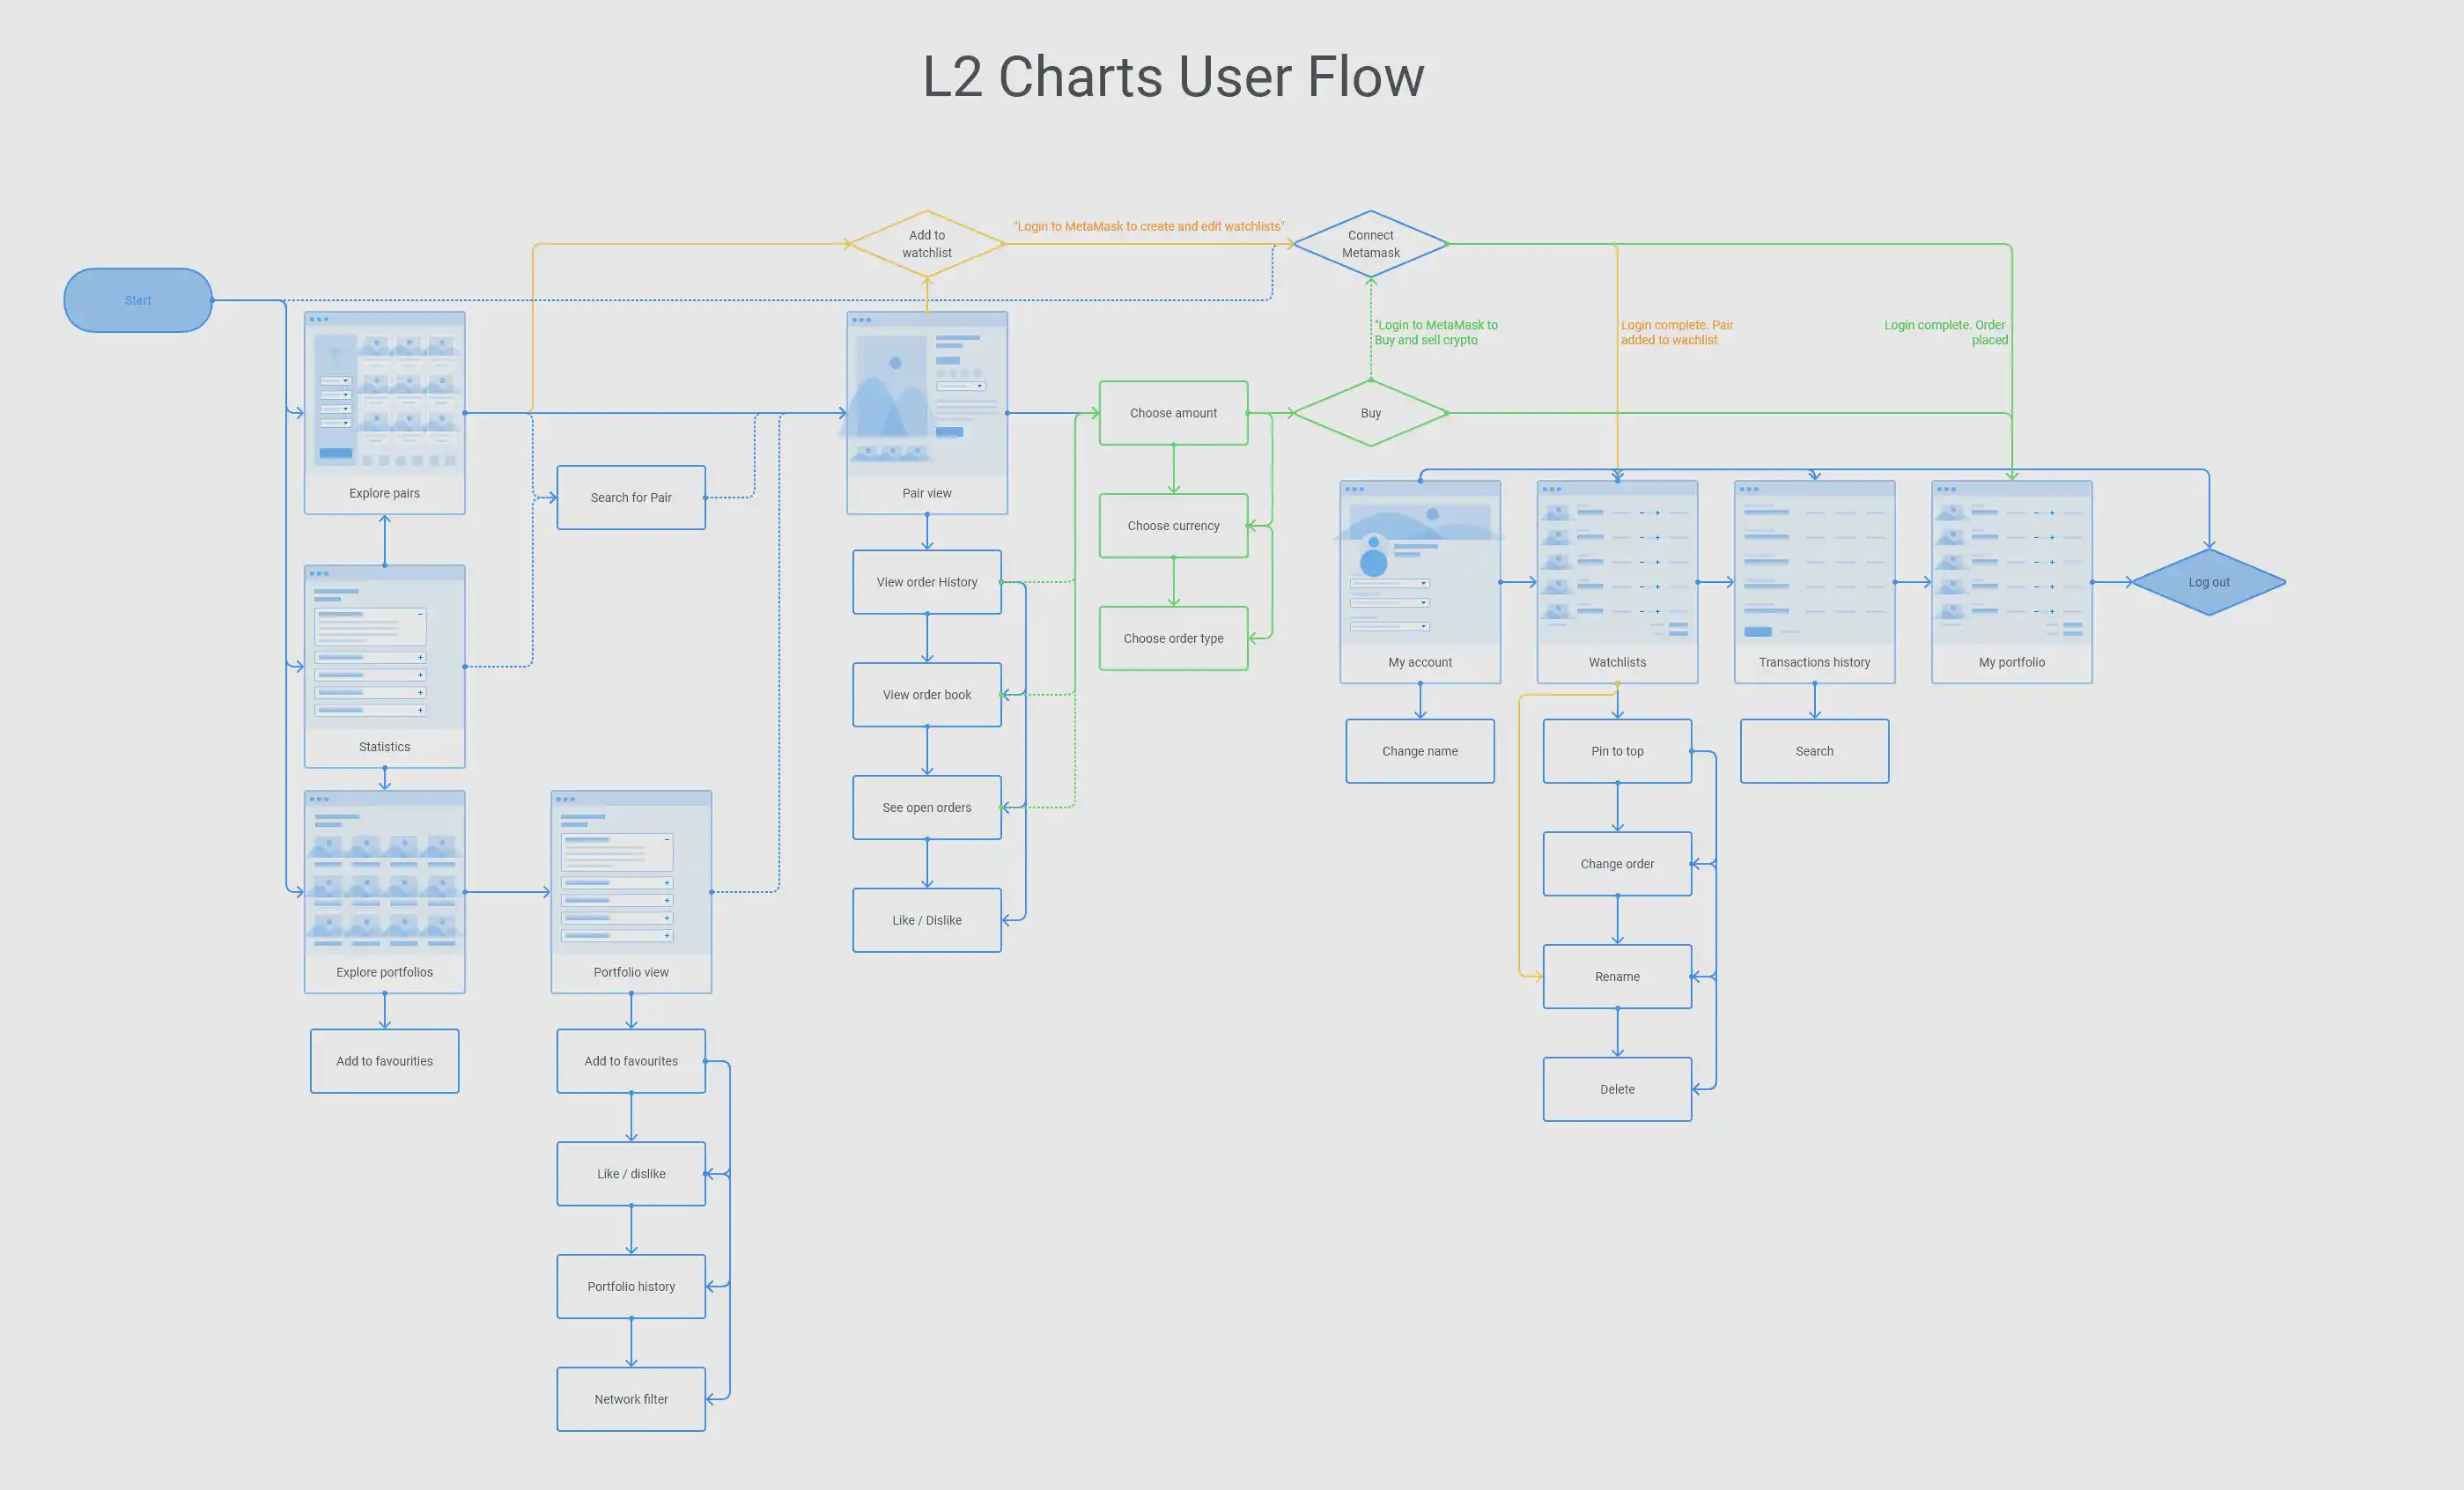
User flow diagram
A comprehensive user journey mapping all interaction points. This served as the foundation for a structured information architecture and a seamless transition between the dashboard and trade execution.
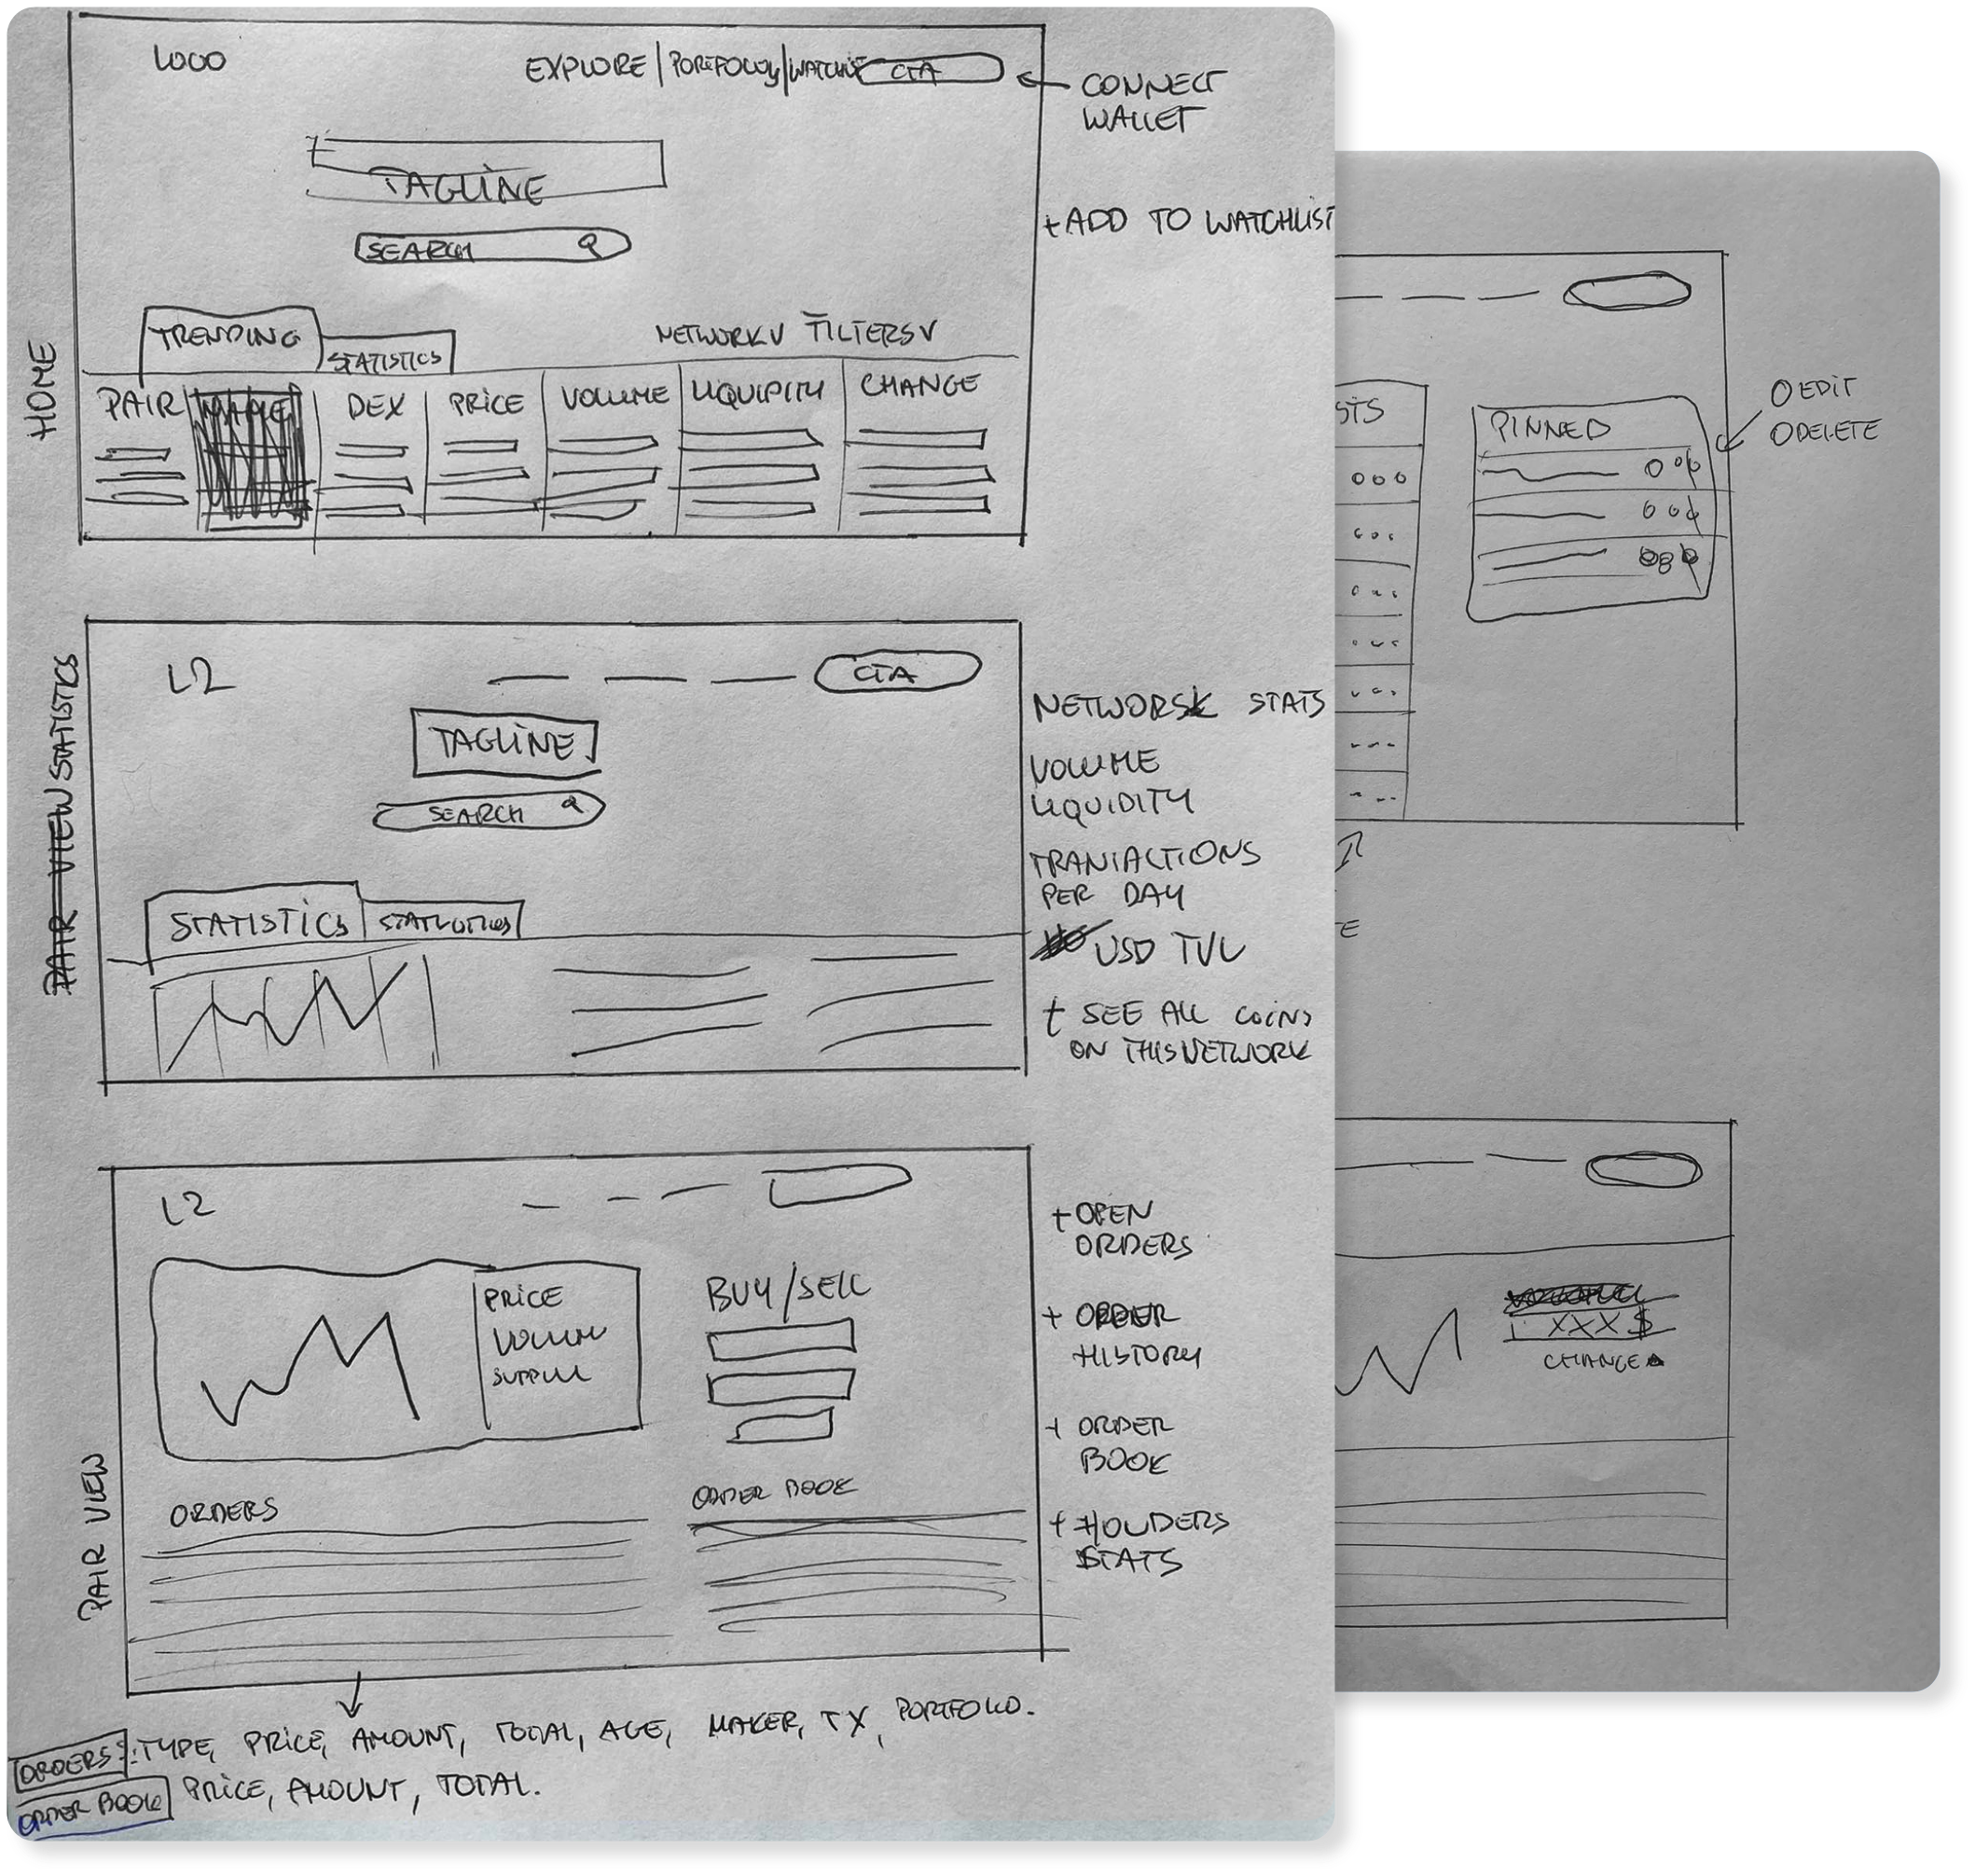
Low - Fidelity wireframes and prototype
I utilized low-fidelity wireframes to iterate quickly on information density. This phase was crucial for testing how users interact with core trading data before applying the final visual layer.
Low fidelity prototype
Validating information architecture and prioritizing core trading actions before moving to high-fidelity visual design
Visual Language & System
Main Colors
Accessibility-first color palette with high contrast for critical trading signals
Secondary colors
Grid

Column width: 122
Gutter: 16
Margin: 144
Buttons
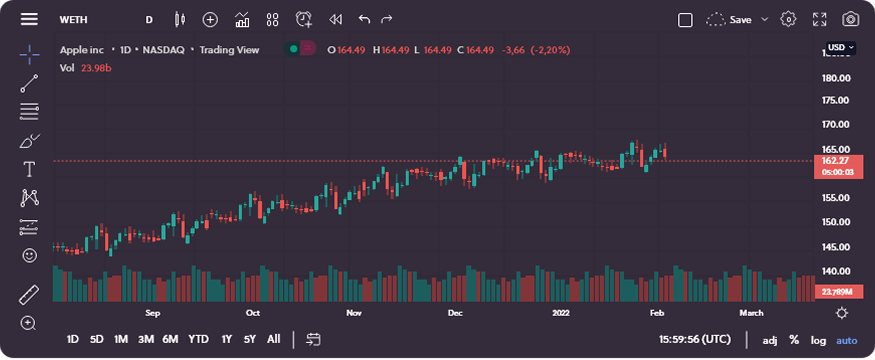
Custom chart design based on TradingView
Custom Trading View Chart module
Lessons Learned
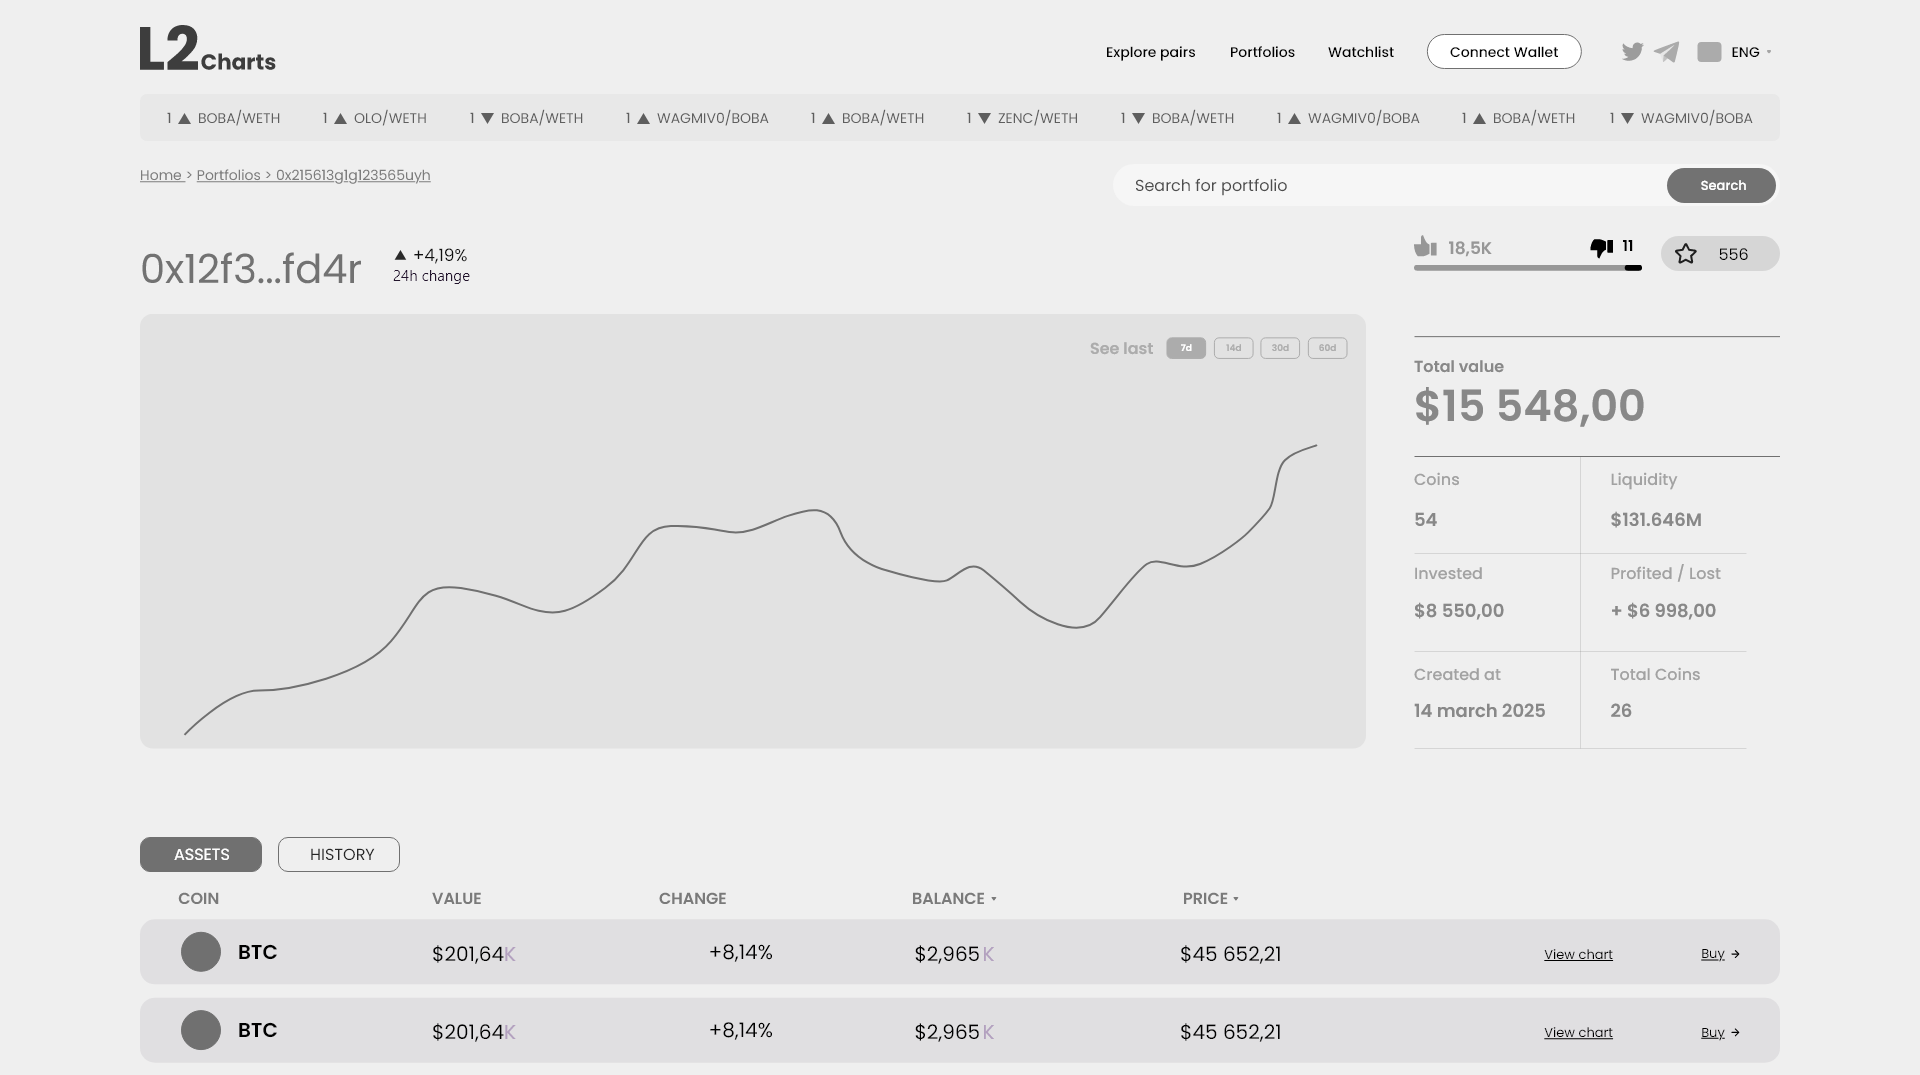
Balancing Data Density
Designing a crypto exchange taught me the art of information hierarchy. I learned how to present complex datasets—like L2 charts and live order books—without overwhelming the user, ensuring that critical trading signals remain the focal point.
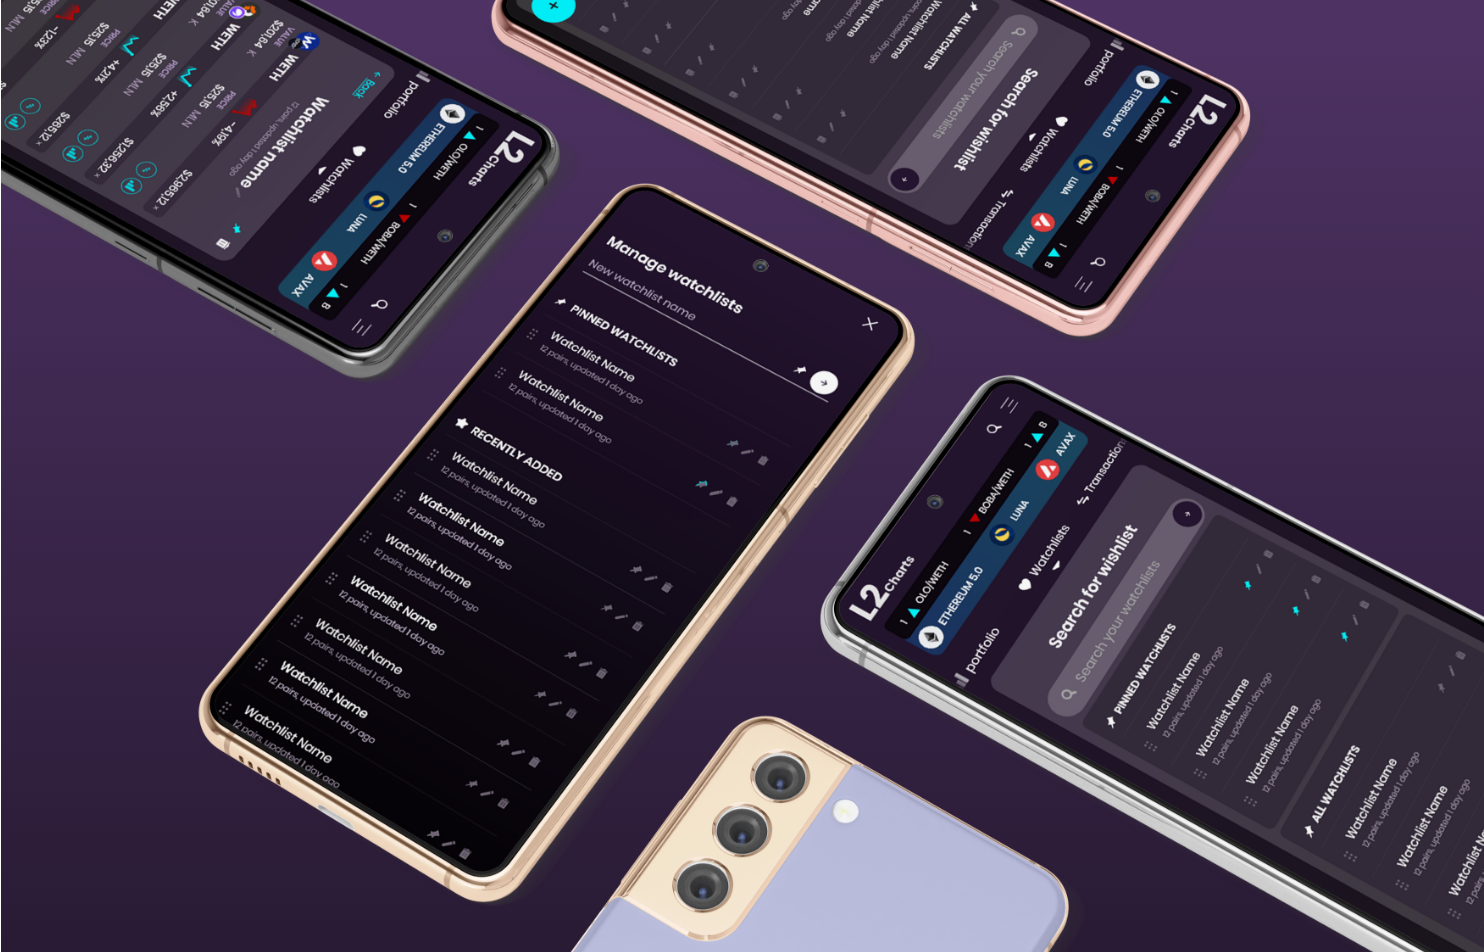
The Mobile Challenge
Adapting high-density financial data for smaller screens was a major hurdle. I focused on progressive disclosure and touch-friendly targets, ensuring that the P2P trading experience remains functional and clear even on mobile devices.
Next Steps & Project Status
Data-Driven Iteration
The next planned phase involved integrating Hotjar and advanced analytics to track user behavior and heatmaps. The goal was to refine the "Buy/Sell" flows based on actual friction points discovered during live sessions.
Project Conclusion
Despite a successful design phase and positive initial feedback, the project did not secure further funding and was ultimately put on hold. However, the architectural foundations and Design System remain a benchmark for my approach to complex Fintech solutions.
Key Takeaway
In the world of P2P finance, great design isn't about how much you can add, but how much you can simplify without losing depth.
CTRLapp - Designing Trust in High-Risk Trading
April 2024
Online printing system for shirts, pillows, socks etc.
January 2023
2026 Paweł Kostyra. All Rights Reserved.